Randall Harris PhD, Matthew Conlan CFA and James Simon
11 March 2022
Methanol vs. LNG key takeaways:
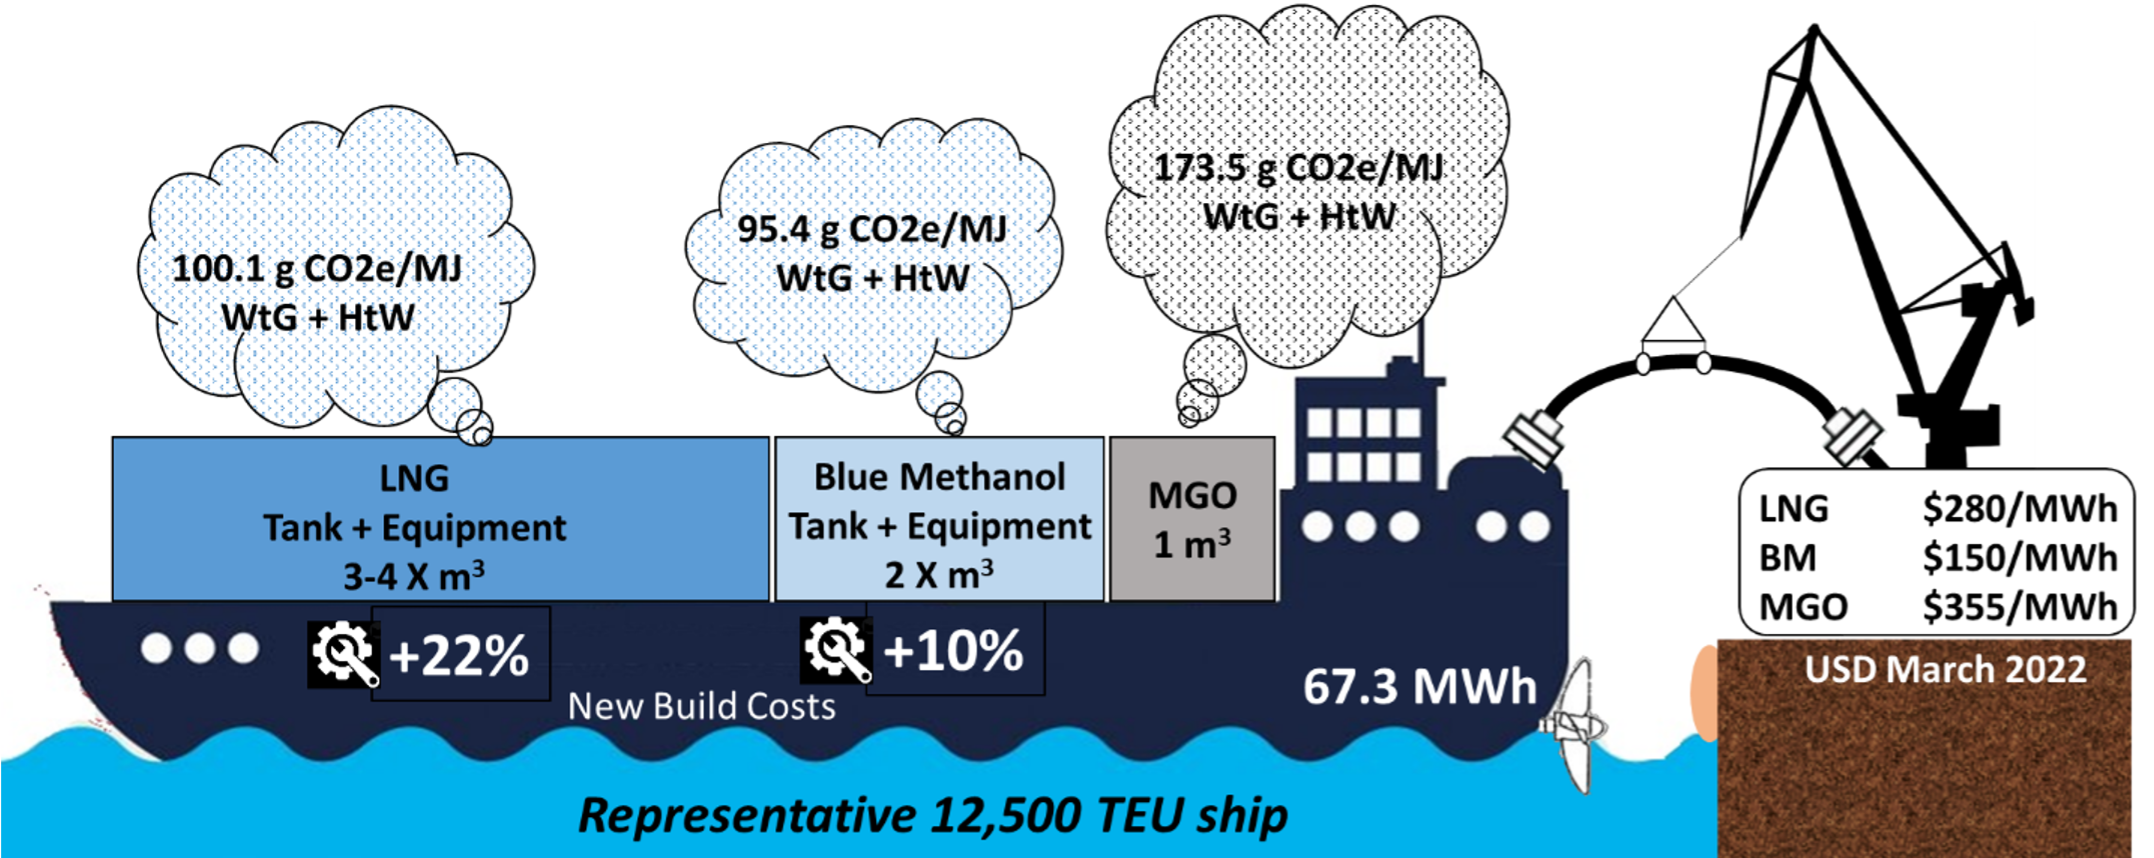
- CO2e footprint of Blue Methanol is 5–10% lower than LNG, combining well-to-gate production footprint and hull-to-wake consumption footprint.
- Methanol fuel costs are less volatile than LNG, and today, methanol is roughly half the cost.
- A methanol-fueled engine adds ≈10% to the cost of a new vessel, LNG engine adds 22% more.
- Methanol is easier to handle and store than LNG, with half the bunkering time.
- Methanol bunkering infrastructure is easier and cheaper than LNG bunkering infrastructure.
- Path to a carbon-neutral methanol fuel is being developed, but no path exists for LNG.
In November 2020, the International Maritime Organization announced that it aims to reduce absolute shipping emissions by at least 50% from 2008 levels by 2050, and attempt to eliminate them completely thereafter. The applicability of alternative fuels in the maritime sector is highly dependent on the fleet type, ship use, ship technical performance, investment costs, environmental impact, and the geographical bunkering location that indirectly determines the availability of alternative fuels. Each fuel comes with its own set of advantages and limitations, with no one-size-fits-all approach.
LNG and Methanol are the two near-term alternative fuels under consideration by the shipping industry to meet the IMO greenhouse gas emissions targets. Methanol is much easier to handle, requires less room and less expense to bunker on the vessel, has a lower CO2e footprint, and is usually cheaper as well.

Figure 1 – Summary of key findings.
The adoption of low-carbon and net carbon-neutral fuels for long-range (LR) and medium-range (MR) vessels is more challenging than for smaller vessels. Using fuels with lower energy content than Marine Gas Oil (MGO), such as LNG and methanol, will require vessel redesigns. LNG will require ~3-4 times as much space as MGO while methanol will require ≈2 times as much space as MGO.
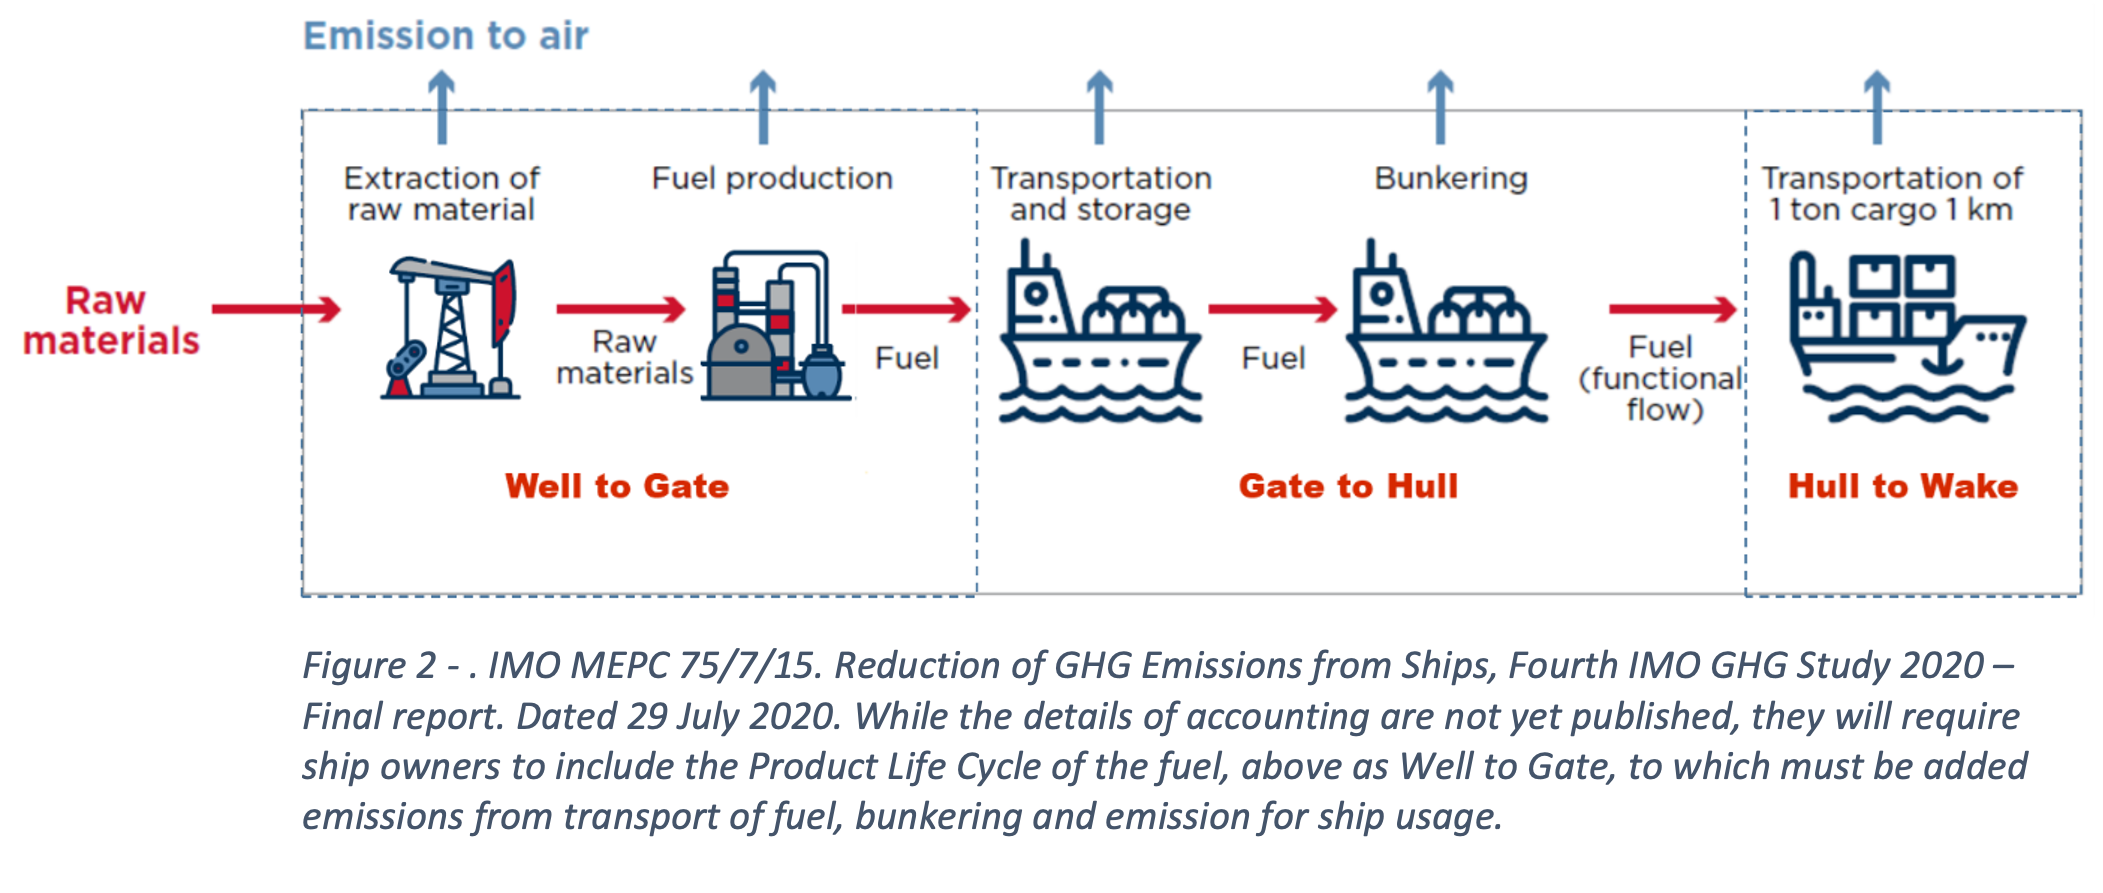
For ship owners’ environmental reporting, understanding the full life cycle CO2e emissions of using LNG and methanol will be required. The Well-to-Gate, or Product Life Cycle Assessment[1], is an important component in evaluating fuel sourcing. Between LNG and methanol, methanol has a lower CO2e footprint[2] and, even if some methanol slips through the combustion process to the exhaust, it doesn’t have the same global warming consequence as methane slip. Maersk, a leader in clean marine transport, has said that they “will not use LNG as a marine fuel, because of the methane slip problems with it.”[3] Instead they have selected methanol as the fuel of choice.

Traditional Grey Methanol, the majority of all methanol commercially available in the world today, is produced by a Steam Methane Reformer (SMR) that burns significant quantities of natural gas to convert feedstock natural gas into a syngas[4] that allows for further processing into methanol.
Advanced Grey Methanol uses an advanced process where the natural gas conversion to syngas occurs in a sealed vessel, an Autothermal Reformer (ATR), where only the natural gas feedstock is heated, greatly reducing the amount of fuel consumed and emissions.
Blue Methanol is a more advanced process that uses an ATR, with a portion of the produced syngas converted to hydrogen and pure carbon dioxide (CO2); the hydrogen is combusted for heat (instead of natural gas) while the CO2 is sequestered, resulting is a near zero-carbon methanol production process.
Green Methanol is produced from captured CO2 and hydrogen electrolyzed from water with all required electrical power coming from renewable sources. While technically feasible, the cost of the Green Methanol process is considerably higher at this time.[5] Challenges to reduce production costs are quite significant, therefore it is not considered a scalable near-term marine fuel.

Figure 3 – Carbon footprints of options less the variability of transport to the bunkering facility and the actual bunkering
The Product Life Cycle Assessments presented above follow the ISO 14040 series standards that address quantitative assessment methods, although our presentation excludes the CO2e emissions from transporting the fuels to the bunkering facility and the actual bunkering itself, as those aspects of the life cycle can have very high variability in emissions.
Brake Specific Fuel Consumption (BSFC) is a marine engineering term used to describe the fuel efficiency of a marine diesel engine, measuring the amount of fuel needed to provide useful power available at the shaft output. The energy contained in the fuel depends on the mass (kg) of the fuel, not on the volume, because the volume depends on temperature.
The fuel cost chart below represents fuel prices in2019. LNG Costs: The Red Dots in the chart are based on LNG costs of about ≈$9/MMBTU, yielding a fuel cost of $80-$85/MWH of Shaft Output. The range of costs was based on LNG costs of about $7/MMBTU – $15/MMBTU. At today’s LNG price of $30/MMBTU, the fuel cost would be about $280/MWH of Shaft Output.

Figure 4 – The red dots above illustrate the energy density of the fuels only. As shown, LNG fuel has both greater volumetric and gravimetric density than methanol. However, when storage tanks and necessary systems are included the picture changes radically for LNG because of the specialized refrigerated/cryogenic or pressurized storage that is required to bunker and utilized LNG aboard a ship. Methanol requires less ship space than LNG for the ship to traverse the same distance.
Methanol Costs: The Red Dot in the chart is based on methanol costs of about ~$300/MT, yielding a fuel cost of $104/MWH of Shaft Output. The range of costs was based on methanol costs of about $250/MT–$400/MT. At today’s methanol price of $425/MT, the fuel cost would be $150/MWH of Shaft Output.
Although not included in the graph, today’s global average price of $987/MT for MGO would imply a fuel cost of about $355/MWH of Shaft Output.

Figure 5 – Energy cost for the fuel/technology taking into account the energy content and system efficiency in LR and MR vessels [USD (2019)/MWh shaft output]
Download this article as a PDF.
For a more detailed study, see https://igpmethanol.com/igpmwp/wp-content/uploads/2022/03/Review-of-LNG-and-Methanol-Marine-Fuel-Options-Exec-Summ-03-10-2022.pdf
[1] IMO MEPC 75/7/15. Reduction of GHG Emissions from Ships, Fourth IMO GHG Study 2020 (29 July 2020)
[2] CO2e – carbon dioxide equivalent – created by the Intergovernmental Panel on Climate Change (IPCC) in order to compare the effects of gases with different global warming potential
[3] F Toud, “Is methanol the best fuel to meet shipping’s green goals?” Ship Technology Journal, September 2, 2021
[4] Syngas is a mixture of hydrogen and carbon monoxide at a ratio of approximately 2 to 1
[5] Electrolyzer manufacturer ThyssenKrupp estimates the production cost of Green Methanol at ~$800/MT when assuming renewable electricity costs of $0.04/kWh. Each MT of Green Methanol requires 10+ MWH of renewable electricity: Every $0.01/kWh of power costs = $100+/MT of production cost of Green Methanol.

